Use of Computerized System
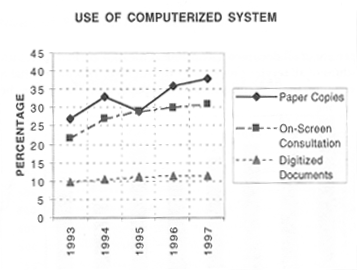
Since 1993, when the system became fully operative at the Archivo, its use has expanded steadily, as shown in Table 1, which compares the following factors for 1993-97:
- Digital image copies as a percentage of total paper reproductions delivered.
- On-screen document consultation as a percentage of total researcher work sessions.
- Both services are compared with the percentage of documents digitized vis-à-vis total existing documents.

Table 1. Percentages of consultation and paper reproduction directly through the computerized system as compared with total percentage of digitized documents.
Data Provenance
Data used in the comparison were taken from two reports, “periodic movement of documents” and “services summary,” derived from the system’s user-management module:
- The first report provides, among other data, the number of visits or work sessions specifically dedicated to consulting original or digitized documents over a given period.
The total figures were:
Original Consultation Digital Consultation 1993 9,649 2,706 1994 7,711 2,893 1995 6,758 2,757 1996 6,474 2,771 1997 (5 months) 2,748 1,245 - Data on paper copies were obtained from another report, “service summary,” derived from the user-management module. No comparison with microfilm use has been made because those figures were skewed by other circumstances, particularly the availability of AGI staff. Consequently, only the figures from paper copies-digitized images versus photocopies-have been compared.
Photocopies Digital Images 1993 143,201 53,906 1994 164,424 78,562 1995 131,842 54,364 1996 148,760 82,819 1997 (5 months) 64,774 41,041
Conclusion
Even though only 12 percent of all documents available at the AGI are in digital form, these documents account for about one-third of all service provided by the Archivo. This means that about one-third of the risk of document deterioration through consultations and paper reproduction has been eliminated.

